Access Latest NAV on Excel
Tracking the latest NAV of your NPS fund in Microsoft Excel is simple. By using the WEBSERVICE function, you can pull real-time NAV data directly into your spreadsheet. Here's how to do it:
Step 1: Use the WEBSERVICE Function
Microsoft Excel offers the WEBSERVICE function, which allows you to fetch external data using a URL. This feature is perfect for tracking NPS NAV data.
=WEBSERVICE("https://npsnav.in/api/SchemeCode")Replace SchemeCode with the actual code of the NPS fund you want to track.
List of all available NPS schemes can be accessed here.
Example:
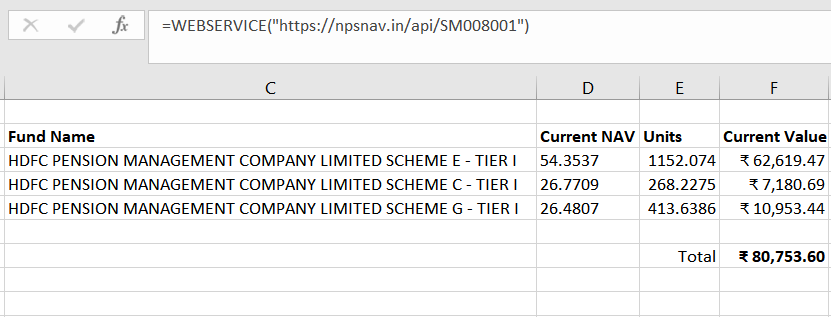
=WEBSERVICE("https://npsnav.in/api/SM001001")Step 2: Calculate the Value of Your NPS Portfolio
Once you have the current NAV, you can calculate the value of your NPS portfolio by multiplying the NAV by the number of units you hold.
Example Calculation:
=WEBSERVICE("https://npsnav.in/api/SchemeCode") * 268Make sure you input the correct scheme code and the number of units you hold in that particular NPS fund.
Step 3: Ensure You Choose the Right Fund
There are multiple NPS schemes under various tiers and schemes. Ensure that you choose the right fund as per your portfolio. You can find the complete list of scheme codes here.
Example NPS Portfolio on Microsoft Excel
Below is an example screenshot of how a sample NPS portfolio looks on Microsoft Excel:
Access Historical NAV Data on Excel
Our historical API allows you to access past NAV values for any scheme. This is particularly useful for tracking performance over time and analyzing trends in fund values.
Using Power Query
For Excel 2016 and newer, Power Query offers a powerful way to retrieve the complete NAV history for any scheme:
Step 1: Create a Power Query
- Go to Data tab → New Query → From Other Sources → Blank Query
- In the Query Editor, click on View → Advanced Editor
- Paste the following code:
let
            // EDIT THIS VALUE DIRECTLY WHEN YOU WANT TO CHANGE THE SCHEME
            SchemeCode = "SM010001", // Change this to the scheme code you want

            // API call and processing
            Source = Json.Document(Web.Contents("https://npsnav.in/api/historical/" & SchemeCode)),
            data = Source[data],
            #"Converted to Table" = Table.FromList(data, Splitter.SplitByNothing(), null, null, ExtraValues.Error),
            #"Expanded Column1" = Table.ExpandRecordColumn(#"Converted to Table", "Column1", {"date", "nav"}, {"date", "nav"}),

            // Convert dates to proper date values for sorting
            #"Added Custom" = Table.AddColumn(#"Expanded Column1", "SortableDate", each
                let
                    parts = Text.Split([date], "-"),
                    day = Number.From(parts{0}),
                    month = Number.From(parts{1}),
                    year = Number.From(parts{2})
                in
                    #date(year, month, day)
            ),

            // Sort by the properly converted date (newest first)
            #"Sorted Rows" = Table.Sort(#"Added Custom",{{"SortableDate", Order.Descending}}),

            // Remove the extra column we added just for sorting
            #"Removed Columns" = Table.RemoveColumns(#"Sorted Rows",{"SortableDate"})
        in
            #"Removed Columns"
Step 2: Load and Use the Data
Click Home → Close & Load to bring the data into your workbook. The query will return the complete history of NAV values for the specified scheme, sorted by date with the most recent values first.
To view a different scheme's history, simply edit the query and change the SchemeCode value at the top of the code. For displaying query, click on Data → Show Queries and double-click on the the query on the right pane.
Step 3: Analyze the Data
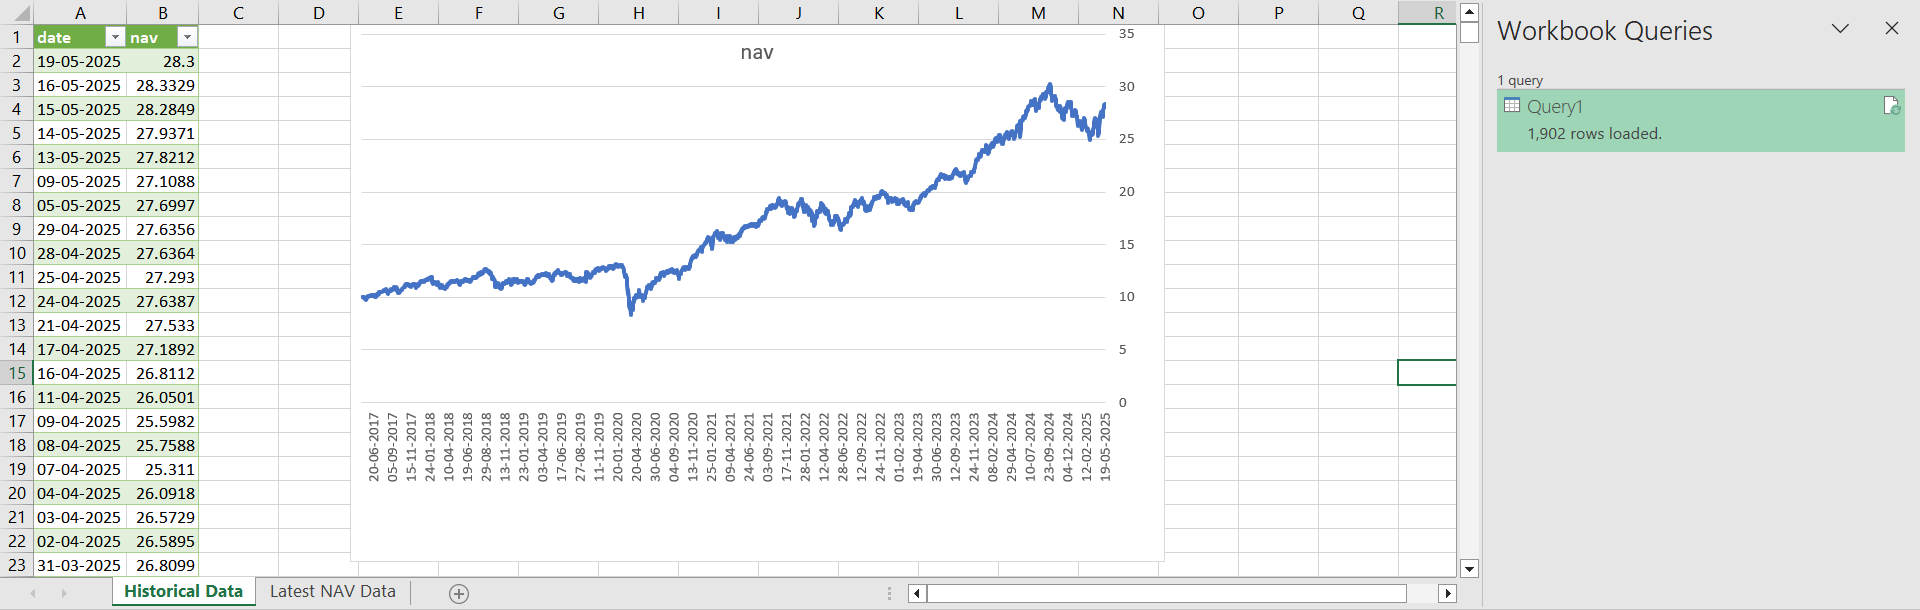
With the complete NAV history loaded in Excel, you can now:
- Create charts to visualize performance trends
- Calculate returns over specific periods
- Compare with other schemes using multiple queries
- Use Excel formulas to find NAVs for specific dates
Understanding the Historical API Response
The historical API returns data in JSON format with this structure:
{
        "data": [
            { "date": "19-05-2025", "nav": 28.3000 },
            { "date": "16-05-2025", "nav": 28.3329 },
            ...
        ],
        "metadata": {
            "currency": "INR",
            "dataType": "NAV",
            "lastUpdated": "19-05-2025"
        }
        }
Power Query handles this JSON structure automatically, extracting the date and NAV values for you.
Trouble tracking NPS NAV on Microsoft Excel? Create an issue or contact us.